TV and Social WEB
The second life of television content
In recent years the way in which users enjoy the television content is radically changed. The process of digitization of content and the broadcast television ecosystem has allowed a significant evolution towards new forms of use, navigation and interaction. We can also note also profound changes in the typical characteristics of the environment in which the contents are consumed: more and more users watch TV content while targeting mobile devices such as smartphones and tablets to interact, comment and deepen programs that are transmitted by broadcasters [5] [3]. The popularity of social networks has changed the Web ecosystem to a more collaborative environment and where the importance of user-generated content becomes ever greater. The analysis of these contents certainly can not represent strictly speaking a statistically representative sample of society, but it certainly has to be taken into account by all stakeholders in order to capture trends, popularity and opinions of a part of users that can not be neglected.
Typically television content produced and aired by broadcasters is enriched with natural language descriptions and metadata and subsequently stored statically on file for subsequent reuse. The broadcaster may also offer online TV content through its Web portal; equally typical operations are the audience analysis in order to quantify the popularity rating of the transmission or the analysis of accesses to its website. What happens next? Many of the programs aired, in this case the more interesting ones, are republished in the network, in whole or in part, by the users themselves (for example on YouTube), during and after the broadcast of the TV content are commented upon by users of the major portals, social networks, like Facebook and Twitter, and gives birth to intense debates on the network.
For TV content then begins a second life during which the audio / video content is watched, “tagged”, “liked”, commented and shared over and over again, becoming a “magnet” that will attract Web users and becoming essentially a Corporate Purpose which conveys emotions, opinions, discussion topics: the analysis of such content can help the different actors to quantify the popularity of the characters and television programs, trends and a crowd pleaser.
The collaboration of the Rai Research Centre activities with the University of Turin subject of this article aims at defining a heterogeneous data integration framework from both traditional sources and social. The system can be defined in a single unified model the knowledge coming from different sources analyzed, enabling innovative research tools and inter-source analysis.
A framework for the integration and analysis of social data
This section shows the architecture of the framework that enables the integration of heterogeneous sources, both social and traditional, in a single knowledge base. It is based on the definition of a graph of knowledge that allows you to represent concepts and relationships between them through a single model.
In figure 1 it is shown the general architecture of the integration framework. It consists of three main levels: the Source Processing Layer, the Knowledge Graph Layer and Knowledge Query and Analysis Layer.
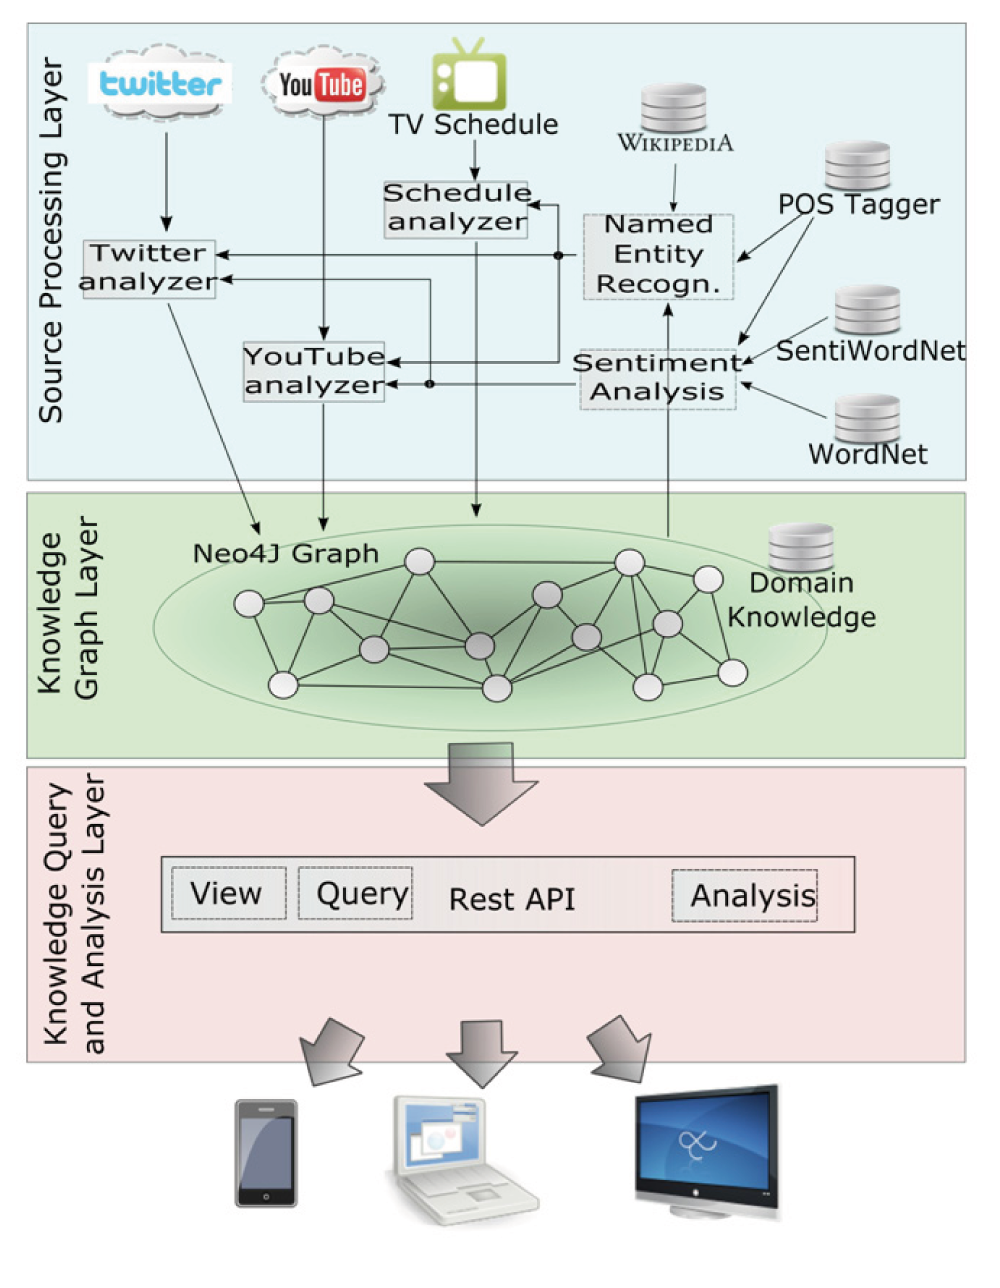
Fig. 1 – System Architecture integration and analysis
The Source Processing Layer
The first level architecture has the task of collecting all the data from the input sources, data that will later be stored in the graph of knowledge, the heart of the framework proposed in this article. It accesses continuously to a predefined number of sources, be they websites, social networks, metadata describing TV programs, and through a number of analysis modules, extracts the information units which will form the new nodes and relationships all ‘ inside the graph of knowledge. On Schedule Analyzer has the task of reading the television schedule information and to orchestrate the different extractors based on, for example, to broadcast programs.
Each source is associated with an extractor that has as input the data stream generated from the same source (eg tweets associated with the television talk show Ballarò, or post and comments in the Facebook page of the program) and produces as a result the set of concepts (characters, places, events, users, emotions, etc.) together with the relationships between them. As we shall see in the next section, the graph of knowledge is a time model of data from different sources and then analyzed allows to store inside the evolution of the observed phenomena. To do this, each analyzer divides the data stream into time windows and, through an analysis phase, extracts the set of most relevant entities, linking them via appropriate relationships, so as to form a new portion of the graph, temporally annotated that in the next section will be identified as Social Subject. It ‘important to note that the size of the temporal window choice may vary depending on the context of analysis: it is possible to decide, for example, to decrease the amplitude of the time window during commissioning of the broadcast program to be able to model the social phenomena with a more fine-grained, compared to times when the same program is not aired and therefore, presumably, less commented.
For the step of extraction of the information from the data stream, the system relies on a set of shared modules between the various extractors that are responsible for executing the most commonly used in this field operations. Among them we can find the modules that perform the classic tasks of Information Extraction systems, such as analysis tools of the text, entity recognition, analysis of feelings.
The recognition of organizations
The module Named Entity Recognizer (NER) has the task, given as input a tweet or comment on YouTube, to recognize the named entities (people, places, events) within the text. We can identify two main phases: identification of entities and disambiguation of entities [9]. The first phase was implemented through the synergistic use of an analysis module of the text, Freeling POS tagger [13], assisted by the use of Wikipedia as the basis of structured knowledge. The first deals with recognizing the text parts that refer to proper names or common (eg: “#barackobama”, “Matteo Renzi”, “Milan”), eliminating verbs, adjectives, articles, etc., While Wikipedia is used to obtain a single reference to the entities from different search keys (for example, “Renzi”, “Matthew Renzi”, “#renzi”).
The second stage of the NER module deals with the most important operation that competes in this unit of analysis: disambiguation. It ‘important to note, in fact, that to a single search key often correspond more candidate entities. This can be done either by coincidence of names ( “Paolo Rossi” can refer to an actor or a player) or because the name of the character is not completely specified ( “Giannini” can refer to Massimo Giannini, the current talk show host Ballaro television, or the actor Giancarlo Giannini). Most of the solutions proposed in the literature are based on the model Bag of Words, in which the disambiguation process is based on the calculation of the similarity between the terms before or after the entities to disambiguate. As demonstrated in the literature, these techniques are ineffective in scenarios such as the one considered in this article, characterized by short texts and not always structured as tweet or comment on YouTube or Facebook. For this reason, the disambiguation module proposed in this article makes use of metadata describing television programs to try to establish which of the candidates returned by the search on Wikipedia is the amount that you wanted to mention. More specifically, for each television program, it was created a mapping with Wikipedia categories within which each item is listed: the system then, among the possible candidates, will prefer those whose categories will be more similar to those associated with the TV program that you are considering. With this algorithm, the search key “Paolo Rossi”, mentions in a stream of Twitter of “The Sunday Sport” will return as a character more likely the player; similarly, the search for the term “Giannini” during analysis of the talk show “Ballaro” recognize it as more likely the current conductor entities “Massimo Giannini.” In addition, the system can be proactively trained through a supervisory system driven by a domain expert user.
The Sentiment analysis
The analysis module of feelings is responsible for extracting the polarity values and emotions from the various sources analyzed. After a preliminary step of extraction of the lemmas, always carried out with the use of POS tagger Freeling, the system uses the vocabulary of SentiwordNet [1], possibly assisted by the use of MultiWordNet [14] for the translation, to extract the value of polarity (positive, negative or neutral) possibly associated with each term. An aggregate function thus allows to calculate the total value of the whole polarity of the data produced by the users in the examined time frame. A similar algorithm is used for the extraction of emotions, based in this case on the taxonomy provided by WordNet Affect [18]. In this way each extractor is able to associate to each block of data referring to a specific time window of a specific program a numerical representation of the views of active users on social networks.
The Knowledge graph layer
The next level (Knowledge Graph Layer) is the heart of the whole system and allows you to represent concepts and relationships extracted from various heterogeneous sources in a unified and homogenous knowledge model. The proposed model is a synthesis of proposals established social theories in the past years in different fields, such as cognitive science [2] [10] [8] [17], the philosophy of language [15] and social ontologies [6] [ 16].
Based on the theories just mentioned, then we can identify three main entities, corresponding to the three types of nodes that are the basis of the graph proposed: Users acting, subjects, the result of their actions, social objects and the representation of objects from them mentioned, the concepts. Any action (or series of acts) that a user in social networks analyzed and that produces social evidence is represented on the graph as a social object. A social object allows you to highlight a report, within a specific time frame, including a set of concepts, be they people, TV programs, places, events, emotions, etc. In this way you can represent, for example, that the journalist Ferruccio De Bortoli is among the nominated characters or that fear is one of the emotions prevalent among those conveyed by Twitter users, during a particular time period, compared to a particular episode the talk show “Ballarò”.
The structure of the model thus provides for the definition of the type of relations that allow to bind parties, social objects and concepts. In particular, a set of users (subjects), which comment a television program, support the creation of a social object; an object is the representation of a social application of one or more concepts in a particular context (for example, a video can be a representation of a sports event). The concepts and, more generally, the entities of the same type can be connected together in order to create complex structures: for example, a comment and a video are two social objects that can be connected by a structural relationship for TV and Social WEB www.crit.rai.it Electronics and Telecommunications N ° 1/2015 33 indicate that the former is part of the second. A taxonomy that classifies geographically that express the concepts of the points is connected through the same type of report. Figure 2 summarizes the structure of the graph.
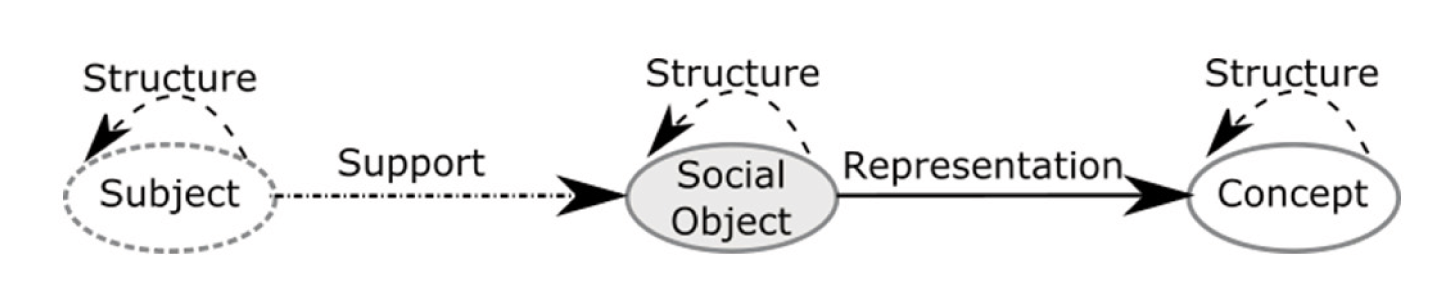
Fig. 2 – General structure of the model to graph
Finally, it is important to note that social objects are by nature transient and evolve over time. For this reason, every social object can be characterized through a time node that expresses a validity interval, connected through a relationship of temporal.
Figure 3 on the next page shows a real case of the knowledge of graph structure used within the proposed system. It refers to the result of the analysis of two data streams from Twitter and YouTube for the same TV program (the commentary of the final of the 100 meters during the 2012 London Olympics).
As you can see, the various extractors have identified the personalities nominated by users within Twitter and comments to a YouTube video, the concept for the event and commented on the emotions conveyed in the comments. For each source, you have created a social complex object (TweetSet in one case, YouTube videos in the other) that allows you to link users, classified by type (active users, supporters, broadcasters) to the most relevant concepts (Usain Bolt, Asafa Powell and others).
As mentioned previously, it is possible to note how the social objects acquire a temporal validity thanks to the presence of a temporal relation with a node that expresses a time interval: in this way, given a time interval of interest, the query level introduced in the next section will be able to identify, analyze and efficiently return only the data that is valid in that time interval.
The concepts that are common representation of social objects coming from the analysis of different sources, also allow you to create a semantic bridge between the different media, thus enabling mechanisms of inter-source analysis.
Finally, figure 3 allows to note how the graph store inside only the most significant relationships that emerge from the analysis carried out by the extractors. In fact, represent every single report and concept, including less frequent, would make it unmanageable model in the next phase of analysis, without making clear benefits to the final results.
For the implementation of the graph described knowledge you were chosen Neo4j NoSQL database [11], which represents one of the industry’s leading technologies. Neo4j allows you to easily manage large numbers of nodes and relationships and provides a convenient management interface based on standard mechanisms (REST). The declarative language Cypher query [4] is an effective query tool based on graph management standard mechanisms.
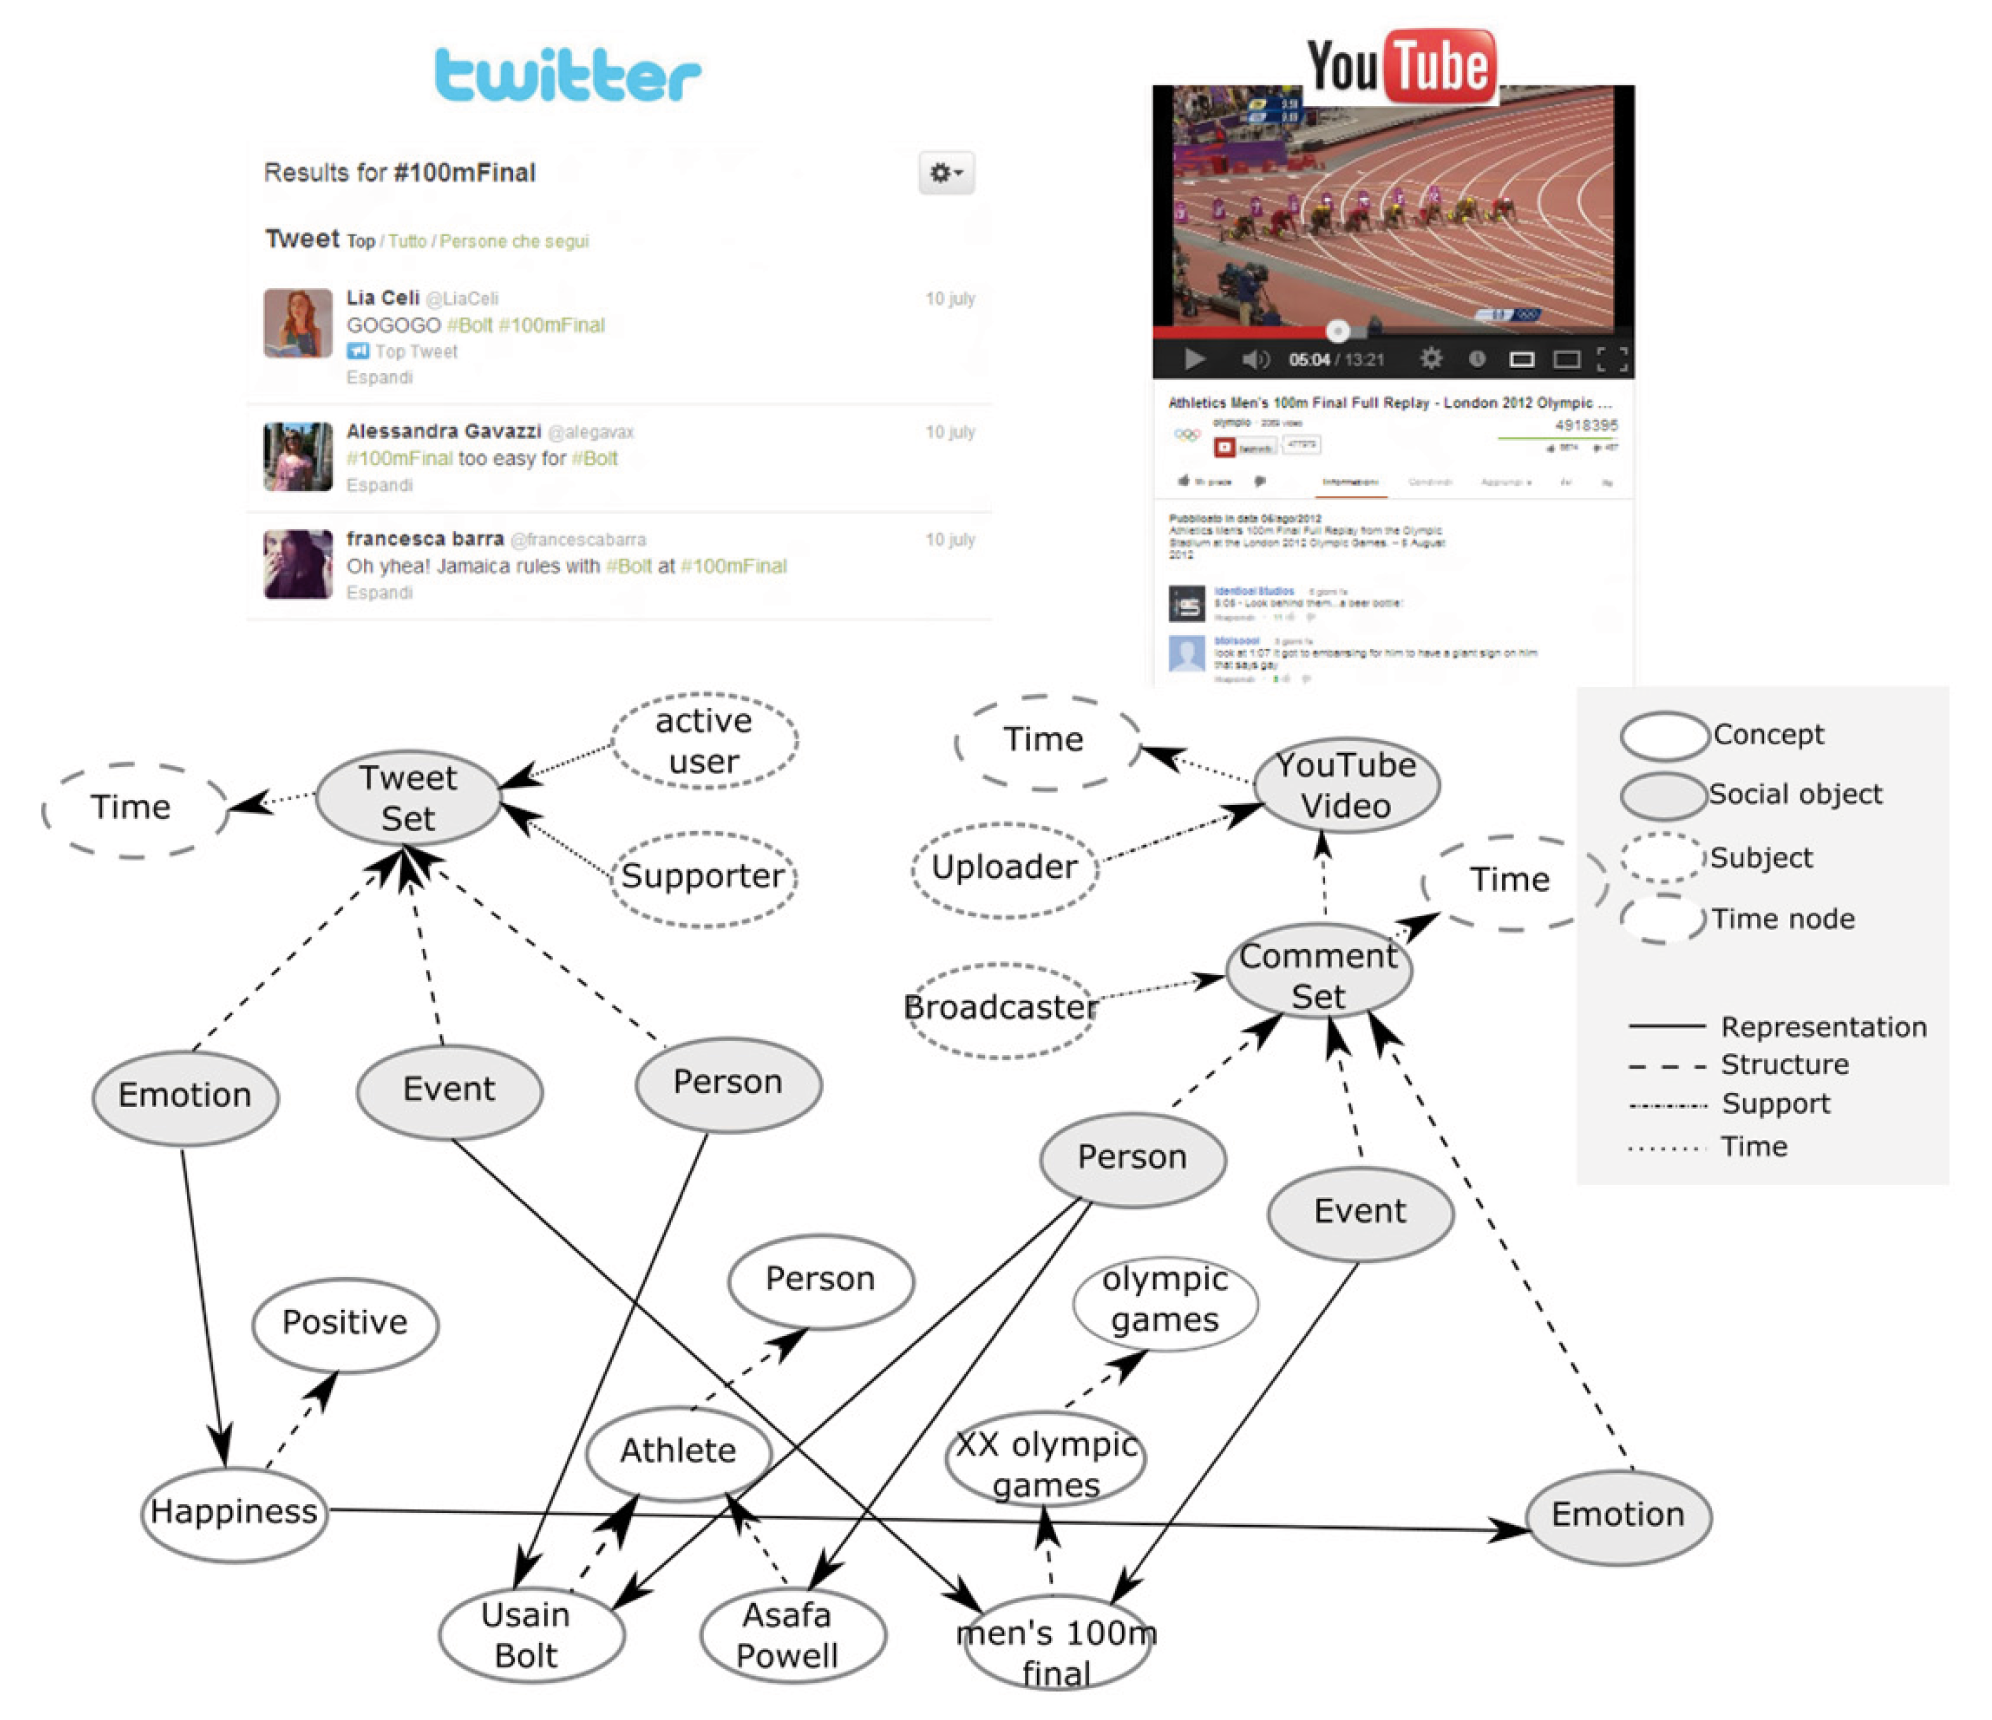
Fig.3 – An example of extraction and integration of data from two different social network
The Query and analysis layer
The third level of the proposed system consists of a series of components responsible for the query, navigation and analysis. The query form allows to extract subgraphs from graph main knowledge, according to criteria established by the user and constraints. Each subgraph extract can be considered as a partial view of the whole graph containing only the nodes and reports relevant to the user.
The analysis module provides the user with a final series of tools based on data mining algorithms can extract recurring pattern, popularity of the characters, and more emerging emotions. It can act directly on the entire graph or use views extracted with query form or more views that can be interpreted as different data structures typical of data mining as matrices or tensors.
A case study: the political talk shows
This section describes a particular testing framework proposed, based on data on episodes of the RAI program “Ballaro” aired between October 2 and November 27, 2012. The selected period is particularly interesting because it is very rich as far as political activity: among the significant events we can mention the local elections in some of the main Italian regions (Sicily, Lazio and Lombardy), then the upcoming elections, the recession, the growing interest and debate around the 5 Star Movement . They were considered two social type sources: Twitter and YouTube. For each episode were collected all tweets containing the search keys # ballarò (official hashtag of the program) or @RaiBallaro (Twitter profile official program).
The extracts comments from YouTube were obtained through research on heuristics related videos, from the title of the program and from the broadcasting date obtained from the schedule analysis module. Below are some case studies that help to understand the potential of the framework.
The social centrality
The first example considered is the study of the importance (in terms of node centrality) of the characters (politicians, conductors, commentators and so on) during startup of the program aired “Ballarò”. To do this, we have considered all the characters that have been deemed relevant by each extractor (Twitter and YouTube in this case) during the observation period, building, through the query form, a graph like the one shown in Figure 4.
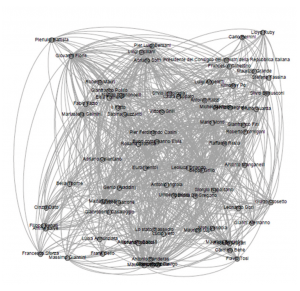
Fig. 4 – Grafo estratto dal modulo di query utilizzato per il calcolo della rilevanza sociale dei personaggi all’interno del caso di studio proposto
Each graph was constructed by adding an arc between two characters if in the time interval considered there is a path that links them through a concept type node that represents an episode of the considered transmission. Since each episode corresponds multiple time windows of analysis, the query form has previously aggregate all social objects valid over the projection horizon. It ‘important to note also that the found paths can also involve different sources, and implementing what, in the previous section, we called inter-source analysis.
Given the social graph constructed according to the procedure just described, the calculation of the betweenness centrality [7] [12] of each node (ie the fraction of the shortest paths from every pair of vertices that also pass by the considered node), allows to obtain the ordered list of the centrality of the concept within the graph of knowledge.
The results reported in Table 1 show that both the comedian Maurizio Crozza that the ex-comedian, now leader of the Movement 5 Stars, Beppe Grillo are the most discussed characters over the analysis period, although the latter has never participated directly in the program as a guest. Follow the President of the Council of the time, Mario Monti, and the host of the show, Giovanni Floris, but also the centrality of characters who would become the new political leaders, as Matteo Renzi, is among the highest.
The popularity Study
The second experiment proposed is to calculate the evolution of the popularity of the characters in the individual considered betting. The concept of popularity is a topic much debated in the literature and in this experiment is linked to the percentage of the character references made in the time period of interest by users of the two analyzed sources.
It ‘important to note that this information, in non-aggregated form, is calculated from each extractor. It is stored in the graph of knowledge within the corporate purpose complex as weight of the representation relation between the social object itself to the concept represented, the analysis result of each time slot. Given a single source, it is then simple for the analysis module, aggregating proportionally all the weights of these arcs to obtain, for each source the relative popularity of each character. At this point the overall popularity intersorgente of each character is obtained through a linear combination of the individual values: where w (i) tw, w (s) yt w (i) are respectively to the weight of each node within the social objects source Twitter, YouTube and the resulting linear combination considering the weights a and (1-a).
Figure 5 shows the trend of the popularity of the six most spoken characters on Twitter and YouTube (with a = 0.5). It can be noted that, while for most of the characters the trend of popularity in the various episodes is quite stable, Matthew Renzi shows a pair of peaks in correspondence of the episodes in which it was host of the transmission. We can also see that Renzi is generally more popular on Twitter than Beppe Grillo, who instead is mentioned again on YouTube (despite never having taken part as a guest to any episode). Silvio Berlusconi’s popularity is very low and in fact he did not figure in the period of observation, among the possible candidates for the center-right camp. You could notice that the popularity of Nichi Vendola takes an appreciable value only during the weeks before the primary elections of the center-left coalition of end November 2012.
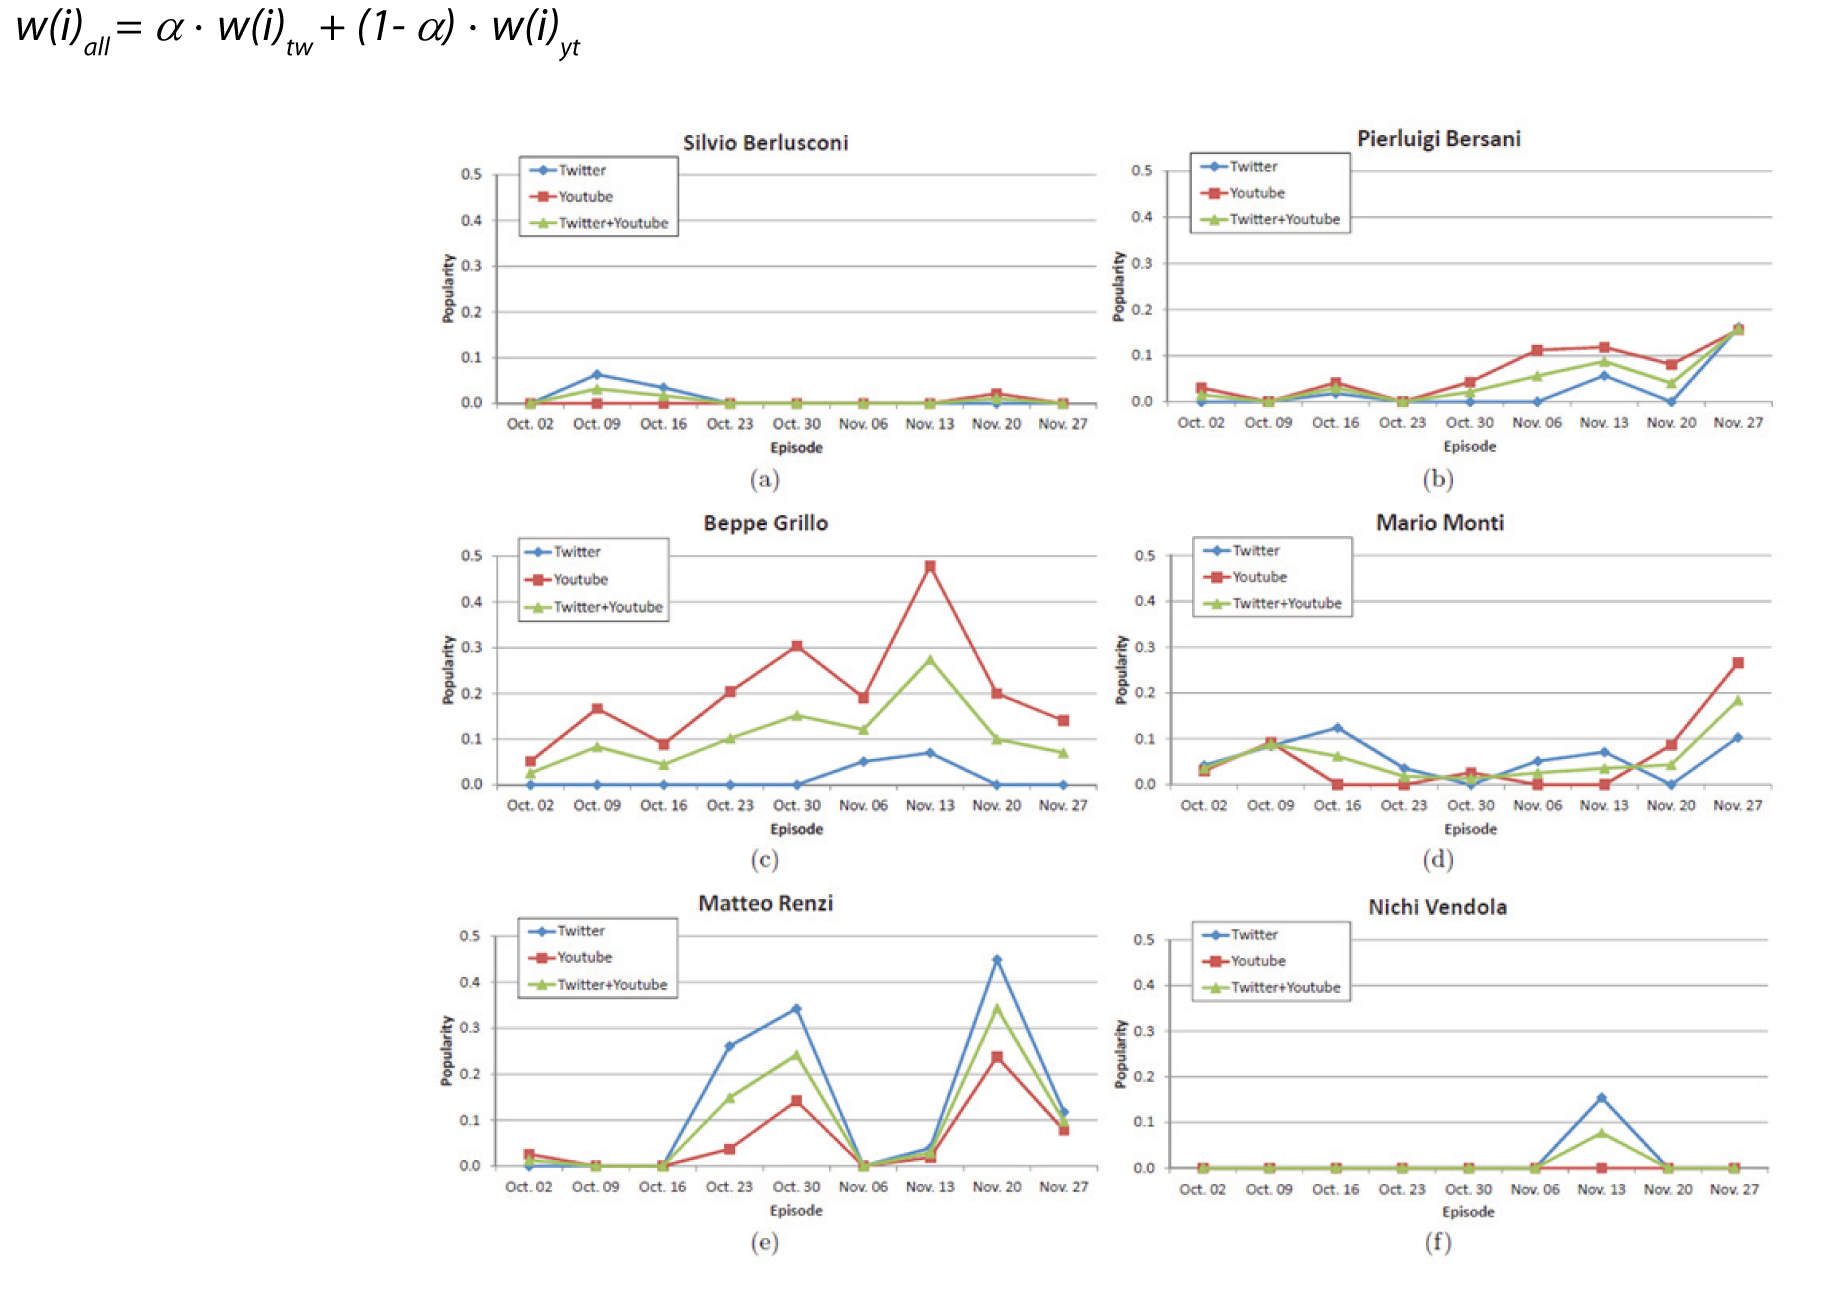
Fig.5 – Trend in the popularity of the six most mentioned characters inside the graph of knowledge
Inter-source analysis
An interesting recent example of intersorgente analysis shows how, through the use of the proposed model, it is possible to bring out the latent relationships between elements from different sources that usually are worlds without apparent contact. More specifically, it is intended to relate the videos posted on YouTube and hashtags used on Twitter related to episodes of Ballarò, in the time the subject of the trial, in order to create a first example of a recommendation service that, given a video posted on YouTube, is able to suggest to the user a set of hashtags to follow on Twitter. Established, therefore, time constraints and the television program of interest, the query engine is able to identify effectively inside the graph of knowledge all paths that connect any YouTube videos to a hashtag twetter, passing by the characters common relevant, identified by two pullers in the Source Layer Processing. In this way you can build a matrix
M: Video x hashtag
where the value of each cell expresses the strength of the relationship between a video and a hashtag in terms of number of television characters in common (as mentioned in the previous section, the concepts represent the nodes which allow to create a semantic bridge between the different sources) . Given the matrix M, you can use one of the more established algorithms unsupervised co-clustering [19] to calculate the inter-source latent associations between groups of videos and hashtag (for further details, see [20]). At this point, since a video, it is immediate to identify the set of most relevant hashtag; the values in the matrix M allows us also to know the strength of the relationship. Figure 6 shows the two cloud tags that express the set of most relevant hashtags associated with two different videos on YouTube: the terms of each individual tag cloud weights are derived from the values of the elements in the matrix M.
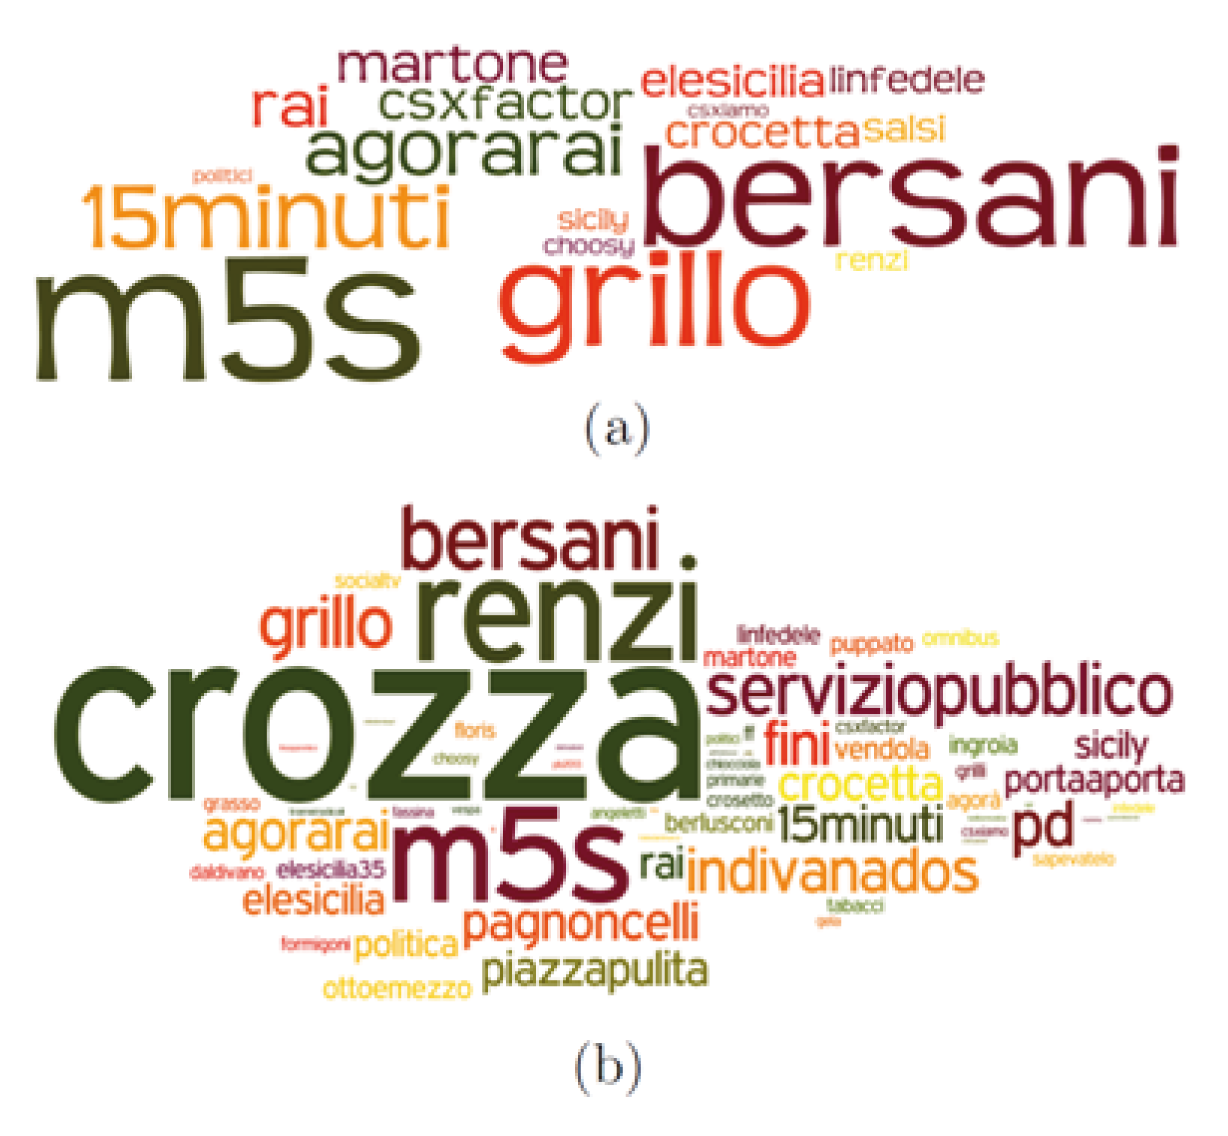
Fig. 6 – Tag cloud of the most relevant hashtags related to two particular video (a and b) published on YouTube
Conclusions
This article has described the activities of the Centre for Research and Technological Innovation Rai in defining a framework for the integration of heterogeneous data from multiple sources both traditional, such as television archives, the EPG and ontologies, both social as twetter and Facebook. The heart of the system is the definition of a knowledge base, based on a graph model, able to efficiently and effectively represent and integrate the activities of users. Some examples have allowed to demonstrate how the system can be used to implement innovative inter-source analysis methodologies, doing, then, emerge from the data the existence of latent pattern.
It is thus expected that the ability to track what has been called the second life of the television content will positively influence the activities of different actors. Broadcasters will have a new type of store that will allow domain experts to have an integrated vision of the evolution over time of the television content with regard to the interest of social network users, and can then analyze, among other things, trends, relationships between characters, the evolution of opinions and popularity. At the editorial level, the analysis platform allows the identification of content, characters, and more emerging themes and discussed by users, thus providing decision support in the schedule planning and the creation of new content. The end user will enjoy indirectly of the advantages of the part of the media company platform. The proposed framework will, in fact, be used as the basis for the creation of recommendation systems for video services on demand and as a source of additional information in second screen applications.
The current work is focusing on three main fronts: on the one hand it intends to increase the expressive power of the model, allowing you to capture even more accurate relevant aspects of user activity on social networks. On the other hand, the accuracy of recognition tools entities and extraction of the emotions is a determining factor of the whole system and for this reason is being a further effort towards continuous performance improvement. In addition, it is being built software prototype that represents, for the end user, a high-level system for the evaluation of the popularity, reputation, feelings, and more generally the trend of TV concepts.
References
[1] S. Baccianella, A. Esuli e F. Sebastiani, Sentiwordnet 3.0: An enhanced lexical resource for sentiment analysis and opinion mining, in “Proc. Of LREC 2010, 17-23 maggio 2010, Valletta, Malta”, pp 2200-2204, 2010.
[2] B. Bara, Cognitive Pragmatics: The Mental Processes of Communication, MIT Press, 2010.
[3] P. Cesar, D. C. A. Bulterman e A. J. Jansen, Usages of the secondary screen in an interactive television environment: Control, enrich, share, and transfer television content, in “Changing Television Environments – 6th European Conference, EUROITV 2008, Salzburg, Austria, July 3-4, 2008 Proceedings”, Lecture Notes in Computer Science volume 5066, pp 168–177, Springer, 2008.
[4] Cypher query language, http://neo4j.com/developer/cypher-query-language/ (last accessed 2015, May 15th)
[5] M. Doughty, D. Rowland e S. Lawson, Co-viewing live tv with digital backchannel streams, in “Proceedings of 9th European Conference on Interactive TV and Video, EuroITV’11, Lisbon, Portugal, June 29-July 1, 2011”, pp 141–144, ACM, 2011
[6] M. Ferraris, Documentality or why nothing social exists beyond the text, in “Cultures. Conflict – Analysis – Dialogue, Proc. of 29th International Ludwig Wittgenstein-Symposium, Kirchberg, Austria, August 6-12, 2006”, pp 385–401. Austrian Ludwig Wittgenstein
Society, 2006. TV e Social WEB 40 Elettronica e Telecomunicazioni N° 1/2015 www.crit.rai.it
[7] L. C. Freeman, A set of measures of centrality based on betweenness, in “Sociometry”, Volume 40, Numero 1, pp. 35–41, 1977.
[8] P. N. Johnson-Laird, Mental Models, Cambridge University Press, 1983.
[9] H. Kopcke e E. Rahm, Frameworks for entity matching: A comparison, in “Data & Knowledge Engineering”, Volume 69, Numero 2, pp.197 – 210, Elsevier, febbraio 2010
[10] G. Lakoff, Women, Fire, and Dangerous Things: What Categories Reveal About the Mind, The University of Chicago Press, 1987
[11] Neo4j Homepage, http://neo4j.com/ (ultimo accesso 18 maggio 2015)
[12] M. E. J. Newman, Networks: An Introduction, Oxford University Press, 2010.
[13] L. Padró e E. Stanilovsky, Freeling 3.0: Towards wider multilinguality, in “Proceedings of LREC 2012, Istanbul, Turkey, May 23-25, 2012”, pp 2473–2479, 2012.
[14] E. Pianta, L. Bentivogli e C. Girardi, MultiWordNet: developing an aligned multilingual database, in ‘Proceedings of the 1st International WordNet Conference, January 21-25, 2002, Mysore, India’, pp. 293-302, 2002
[15] J. R. Searle, Speech Acts: An Essay in the Philosophy of Language, Cambridge University Press, 1969.
[16] J. R. Searle, The Construction of Social Reality, Simon and Schuster, 1995
[17] R. E. Shaw e J. E. Bransford, Perceiving, acting, and knowing: Toward an ecological psychology, Lawrence Erlbaum Associates, 1977.
[18] C. Strapparava e A. Valitutti, Wordnet affect: an affective extension of wordnet, in “Proceedings of LREC2004, Lisbon, Portugal, May 26-28, 2004”, pp. 1083-1086, 2004
[19] I. S. Dhillon, S. Mallela e D. S. Modha, Informationtheoretic co-clustering, in “Proceedings of ACM SIGKDD-2003, Washington, DC, USA, August 24-27, 2003”, pp. 89-98
[20] A. Antonini, L. Vignaroli, C. Schifanella, R. G. Pensa, e M. L. Sapino, MeSoOnTV: A media and social-driven ontology-based tv knowledge management system, in “Proceedings of the 24th ACM Conference on Hypertext and Social Media, Paris, France, May 1-3, 2013”, pp. 208-213, 2013
Related Projects

Active project
Rai Like
social networks analysis in the television environment
The huge transformation on how we enjoy television content is by now a fact, it is increasingly emerging that the second screens (PCs, tablets, smartphones) have become a structural extension of television media, so that content producers are called to address the challenge of providing real-world entertainment and information experiences that can be viewed through different device and media in synergy.
From these considerations there are new opportunities for the entire television production sector. Social media, in particular, can increase the knowledge of user’s perception of the program and at the same time maximize the audience using multiple screens. The picture that we are looking requires to offer no more simple television products such as linear audio / video but true experiential paths, a profound transformation of the television offer not only multi-device but trimmed to the needs of the user, able to capture user in the most diverse situations. This requires an in-depth knowledge of consumer behavior.
In this context it becomes essential to identify the synergies between the television world and the WEB, with particular attention to social networks and what level of integration and collaboration can be achieved between the two worlds.